Making my website faster
A different level of performance optimization
- How slow was it?
- Sources of slowness
- Improving the text pop-in behavior
- Lazy-loading the search index
- Reducing the cost of webfonts
- Combining CSS files
- Results
- Conclusions
- Appendix: how to lazy-load a big GIF without scripting
Since I started running this site in 2011, I’ve adhered to some principles to make it fast, cheap, and privacy-respecting.
- As few third-party cross-domain requests as possible – ideally, none.
- No trackers (which tends to follow naturally from the above).
- Use Javascript but don’t require it – the site should work just fine with it disabled, only with some features missing.
- No server-side code execution – everything is static files.
Out of respect for my readers who don’t have a fancy gigabit fiber internet connection, I test the website primarily on slower, high-latency connections – either a real one, or a simulated 2G connection using Firefox’s dev tools.
I was doing an upgrade of my httpd2 software recently and was frustrated at how long the site took to deliver, despite my performance optimizations in the Rust server code. To fix this, I had to work at a much higher level of the stack – where it isn’t about how many instructions are executed or how much memory is allocated, but instead how much data is transferred, when, and in what order.
On a simulated 2G connection, I was able to get load times down from 11.20 seconds to 3.44 seconds, and the total amount of data transferred reduced from about 630 kB to about 200 kB. This makes the site faster for everyone, whether you’re rocking gigabit fiber or struggling to get packets through.
In this post I’ll walk through how I analyzed the problem, and what changes I made to improve the site.
How slow was it?
My site was already pretty fast compared to most modern websites. Between cross-domain trackers, excessive use of Javascript frameworks, odd server configurations, and peppering the user with popups and ads, it can be a while before a typical website becomes usable, even on the fastest of connections. “Manage cookies?” “SUBSCRIBE TO OUR MAILING LIST FOR SOME REASON!” etc.
I use the “Good 2G” setting in Firefox’s devtools (equivalent to “Fast 2G” in Chrome) to simulate a 450 kbps connection with 150 ms of latency. This is very similar to the internet connection I get in practice when I’m in the wilderness. Doing this makes it very, very clear how much work a website is doing.
Benchmark: a blog post before optimization
I’ve been testing using my article Composing Concurrency in Drivers. It’s a pretty representative sample of my site, with a lot of English text, some code samples, and few images. It should serve as fast as anything on the site.
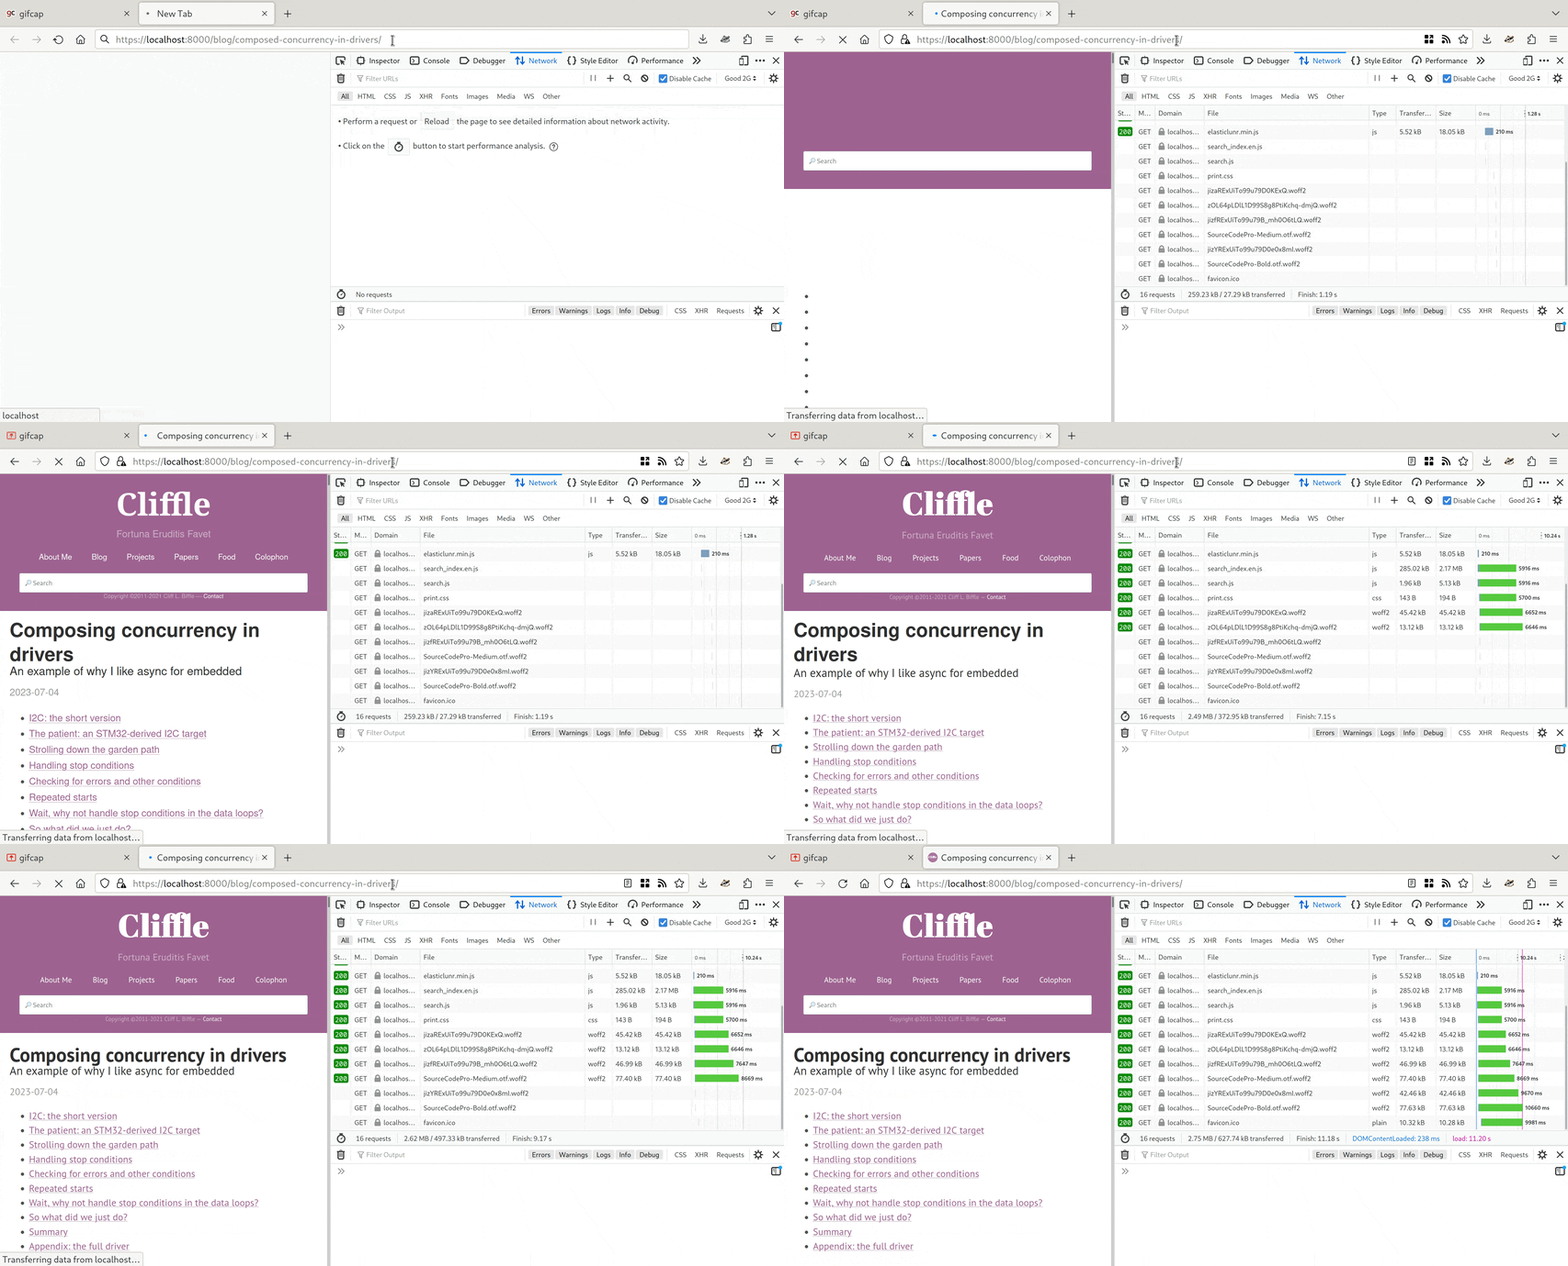
And yet – on the simulated 2G connection I was seeing
- 3 seconds before any text was visible at all!
- 10 seconds before the layout totally stabilized.
- 11 seconds total.
- 2.75 MB transferred, compressed to 627.74 kB on the network.
I have a very short attention span, so I have a hard time tolerating that kind of performance.
To help you understand how loading the page felt before my changes, I’ve recorded an animated GIF of the process, which you can view here:
Large GIF hidden by default, may take a bit to load
Comparison: CNN
For comparison purposes, I disabled Privacy Badger and loaded cnn.com through
the same simulated 2G connection. It took nearly a minute before any text on the
page was readable, over 90 seconds before the page layout stopped jumping
around, over two minutes before the layout appeared to have stabilized with the
final fonts etc., and after four minutes something in the background was still
loading.
The site was also waiting for the first user interact to start downloading a bunch of video ads, so as soon as I went to scroll, another 16 MB of data started coming in. This “wait for interact to do a bunch more work” behavior is pretty common; it started as a way to try to hide popups and similar nonsense from the Google landing page quality crawler. (I know this, because I was working on it at the time.)
Anyway, I digress. My point is that, on a 450 kbps connection with 150 ms of latency, much of the modern web sucks.
But that doesn’t mean my site has to suck. I can do better.
Sources of slowness
Using the “Network” tab in Firefox’s devtools, I got a “waterfall” timeline chart of all of its interactions with my server. (I was doing this to verify some functionality I added to my webserver… but then I noticed how long the timeline was, and started down the rabbit hole that led to this post.)
Firefox’s “throttling” feature that simulates slower network connections doesn’t simulate resource timing very well, so it’s easiest to see the details of the timeline if you disable throttling. In my case, with throttling off, loading my page looked like this:
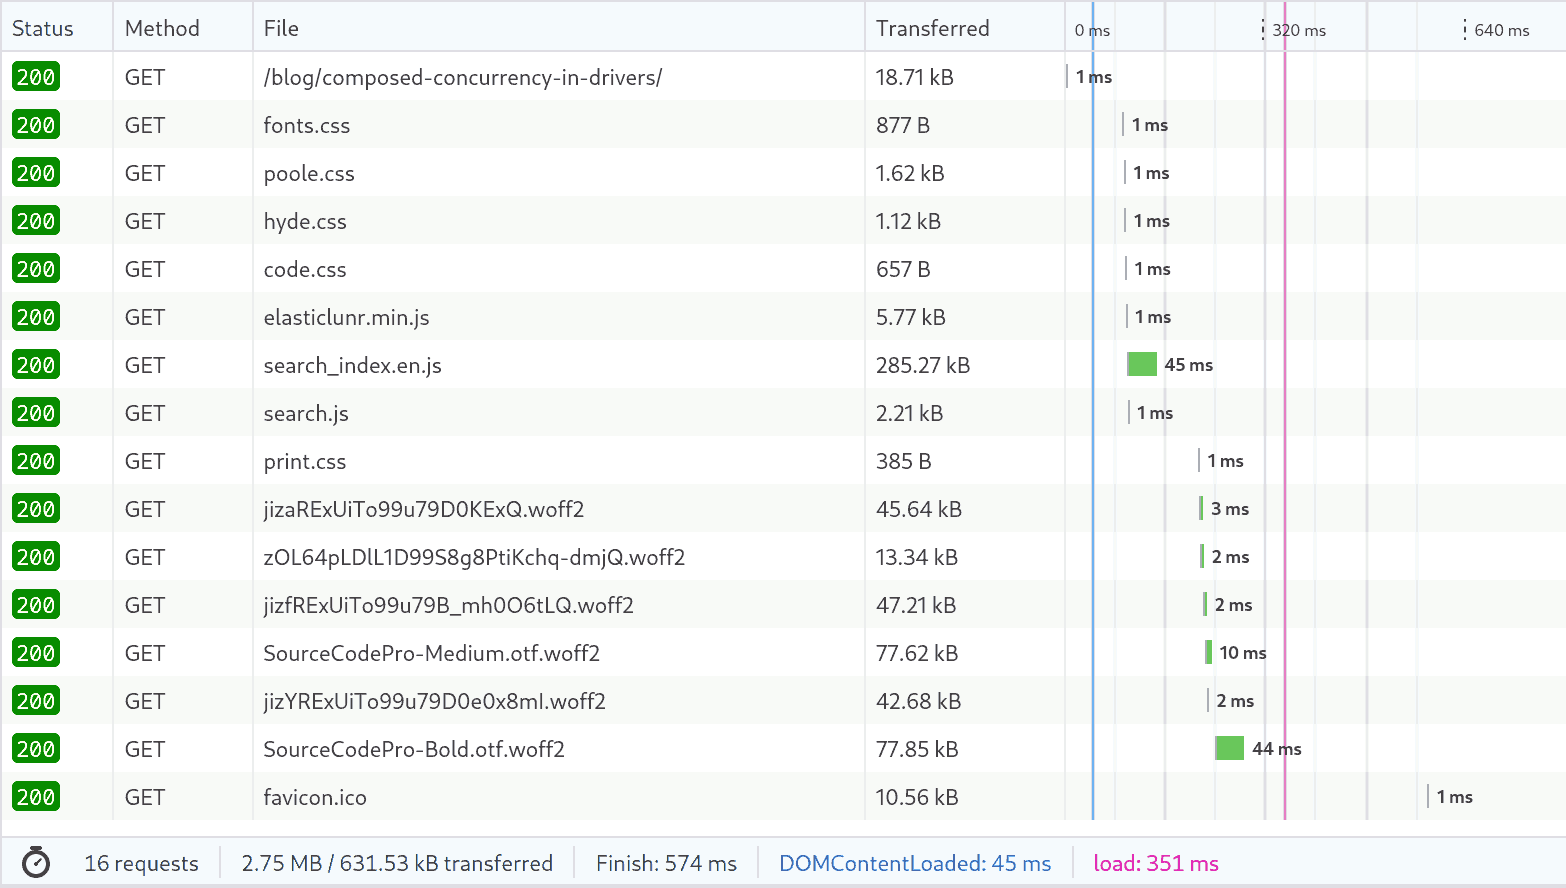
In this case I’m loading the site from localhost, so this is basically the
best possible experience with infinite bandwidth and zero latency.
What we can see here is that…
- The actual HTML page of the article loads first, and compresses to 18.71 kB for transmission. (My site uses gzip transfer encoding where appropriate.)
- The browser then, after a significant delay (about 90 milliseconds), issues a second batch of requests, for several CSS stylesheets and three Javascript source files. One of those Javascript files is large, at 285.27 kB compressed – it’s a full text search index of my entire site, to implement client-side search.
- Then, after another significant delay (just over 100 milliseconds), the browser issues a third batch of requests: for one more CSS stylesheet and a whole mess of webfonts in WOFF2 format.
- The overall load process takes 351 ms, even with effectively infinite bandwidth.
What’s the source of the latency between loads? Why are the loads happening in batches? It turns out these questions have the same answer.
But first, I’d like to point out something that isn’t the problem – HTTP connection overhead. This entire process uses a single HTTP connection over TLS. Thanks to pipelined requests (HTTP/1.1) or multiplexing (HTTP/2) the browser can make a single connection and then issue groups of requests over time. Without this, things would be dramatically slower!
The reason for the batching behavior is parsing and script execution. To understand this, we need to develop some “machine sympathy” for the browser, and consider what I’m asking it to do when I write my website in this particular way:
- First, download this HTML page containing an article.
- Parse the HTML and find resources used in its construction and layout – specifically, CSS stylesheets and Javascript files.
- Go and fetch those files. (This is the second batch of requests.)
- Parse those files and execute them. This process may reveal more things we
need to fetch – in this case, webfonts linked from stylesheets using the
url(...)construct in CSS. - Go and fetch those files. (This is most of the third batch.) In this case, those don’t contain any further links to files, so we can stop the recursion.
- Finally, check for any resources embedded in the page that aren’t needed
for layout, but may be relevant soon. On this article, the only such resource
was the stylesheet I use when you print one of my pages. This was tagged with
media="print"in the HTML, so the browser treated it as a second-priority download, and fetched it at the end of the third batch.
Parsing HTML, CSS, and Javascript isn’t trivial, and in the case of CSS and Javascript, the result needs to be executed to see what happens next. On my machine, my browser takes about 90-100 ms per round of parse-execute-and-repeat that the page asks for – again, with effectively infinite bandwidth.
From a user experience perspective, the fact that the fonts download last – in the third batch – is a problem. We need the fonts to render text, and the way I had written the CSS stylesheets, the browser would wait to display any text on the page until the fonts were ready. That means we’re waiting a minimum of about 200 milliseconds before the page pops in. (On a slow connection it’s much worse, as you can see in the animation above.)
Improving the text pop-in behavior
I made two changes to improve the font pop-in:
- I added directives to the HTML to start loading them before the CSS is loaded and parsed, which moves them to the first batch.
- I fixed my CSS to specify that it’s ok to render the page with a system font if the webfont isn’t ready yet.
An HTML preload directive goes in the <head> section and looks like this:
In my case, I was loading fonts, which means ROLE is font. But there’s
another subtle detail where fonts are concerned – the request specified in the
preload directive must exactly match the request generated by the CSS, or the
browser won’t treat them as the same data, and will load the font again. In my
testing, this means that
- The URL used in
hrefmust exactly match the one in the CSS – in my case,/fonts/xyzandhttps://cliffle.com/fonts/xyzare not the same! - The directive needs the
crossoriginattribute, because CSS-initiated loads of webfonts are apparently always treated as cross-origin requests. (I didn’t take the time to understand the rationale.)
So, concretely, we wind up with
and then we have to ensure that the url(...) directive in the CSS exactly
matches the text of the href. While we’re in there, we need to add the
font-display: swap attribute. This permits the browser to render text using
the system font and then replace it with the custom webfont when it finishes.
Finally, in Firefox at least, it appears to matter whether the link rel="preload" directives appear before or after the the link rel="stylesheet"
directives used to load CSS files – specifically, it seems to be important that
preload comes first.
With this change, the webfonts move from the browser’s third batch of requests into the second, and are loaded about 100 ms earlier. The browser also renders text before the webfonts arrive (or its load timer times out), which moves text rendering several hundred milliseconds earlier.
But on a slow connection, that hundreds of milliseconds is lost in the noise – the fonts still take time to download. I’ll improve that in a later section.
Lazy-loading the search index
The single largest thing loaded in the second batch of requests is
search_index.en.js. It’s almost 4x larger than even the biggest webfont I
used. Plus, it’s Javascript, which means it needs to be executed to find out if
there’s more work to do.
Before the font preloading I added in the previous section, the browser would
wait until the search index was completely downloaded before it began loading
the fonts. On a slow connection this caused a significant and visible delay to
rendering. Now that the fonts are preloaded and specify font-display: swap,
rendering can largely complete before the search index finishes – but because
the transfer of the search index is happening in parallel to the transfer of
the webfonts, it is slowing them down, and so it still has an effect on how
quickly we can render the final page!
The search index is only really required to use the search box. I have no idea how often people use the search box, because it’s entirely client-side and I have no trackers on the page. But I assume that most people who arrive at my site to read an article probably don’t immediately open the search box.
This is an argument for lazy-loading the search feature.
What I eventually decided on is:
- Have the HTML load only a single
search.jsfile (2,892 bytes compressed). - The code in that file configures an event handler on the search box, which will detect when the user has focused it.
- Only then will the browser begin downloading the search index in the background.
I also wanted to take the opportunity to make the user experience better for people who are browsing with Javascript disabled. For them, the search box does nothing. So I disabled it by default in the HTML:
…and then had the setup routine in search.js enable it and attach the event
handler, which I cleverly named callback:
// Find the box.
;
// Enable it since we've got Javascript
$searchInput.disabled = false;
// Is it already focused? This can happen if the user is fast and
// the connection is slow.
if document.activeElement === $searchInput else
You might be wondering about the if/else at the end there – this fixes a
bug. It’s the sort of bug you only find by testing your website on slow
connections.
If the user is really excited about running a search, they might click/tap the search box before the page is finished loading. On a slow connection, where the page load takes several seconds, this is really easy to do.
The Javascript code above only runs when the page load is mostly complete. This
means if it just naively registered a focus handler on the search box, it
would never receive the event, because the box is already focused. So, I check
against document.activeElement, which is the focused DOM element, to deal with
this race condition.
The way to actualy perform lazy loading of Javascript (in the callback
routine) is super weird. (The web platform in general is like a bizarro-world of
programming.) To load our scripts, we rewrite the <head> section to contain
<script> tags referencing them and let the browser figure it out.
Really.
// Build a <script> node referencing the search implementation.
;
script_code.type = "text/javascript";
script_code.src = "/elasticlunr.min.js";
// Do not set an event handler for when it's done,
// as the two scripts will be loaded in DOM order.
// Build a <script> node referencing the search index.
;
script_idx.type = "text/javascript";
script_idx.src = "/search_index.en.js";
// Arrange to invoke the original, eager, initSearch
// routine when it finishes loading.
script_idx.onreadystatechange = initSearch;
script_idx.onload = initSearch;
// Now, sneak them into the <head>. This causes the browser
// to load it once we return control to the event loop.
// The order is significant.
;
script_code;
script_idx;
// Update the placeholder to show that something is happening.
;
$searchInput.placeholder = "Loading, please wait...";
That code manufactures two <script> tags and stuffs them into <head>… and
then does something else you would only notice on a slow connection: it presents
a loading message.
Without this, if the user taps/clicks/tabs/focuses the search box, we’d kick off the download of the search index in the background. Until it completes, any typing they do in the box won’t run a search. On a fast connection, you probably won’t even notice the delay… but on a slow connection it could easily take 10 seconds or more. During that time, the user will now see a “Loading…” message, which will hopefully prevent them from getting frustrated and deciding search is broken.
This change reduces data transferred by 285 kB, or 40%. It also leaves more bandwidth free for the fonts to finish downloading. This significantly improved the perceived load speed of the page.
Now, the long pole is definitely the webfonts. Let’s see what we can do about that.
Reducing the cost of webfonts
The webfonts I use on my site are in WOFF2 format, which is already compressed, ruling out the easiest way of making them smaller. Instead, I chose a combination of two methods:
- Sending fewer fonts.
- Making the fonts I send smaller.
Sending fewer fonts was pretty easy. My site was using the CSS generated by the Google Fonts service (hosted locally of course). On inspection, this CSS included fonts for text encodings I don’t use, or don’t use very often.
Originally, when I was relying on the CSS url(...) syntax to load the fonts, I
got part of this for free. Seeing url(...) in a CSS file isn’t enough for the
browser to go load the font – it waits until the font gets used, and
specifically, gets used for a Unicode codepoint that’s actually in the font.
The Google Fonts generated CSS already subset the fonts into several pieces,
covering basic Latin characters, Latin-Extended, and Cyrillic. Before, my site
would typically only load the Latin fonts.
By taking all the font URLs specified in my CSS and converting them into link rel="preload" directives, I had actually made things slightly worse, because
preload happens unconditionally. So I was instructing the browser to download
fonts that wouldn’t actually wind up being used!
Fortunately, Firefox has a diagnostic for this – after a few seconds, any preloaded files that it didn’t wind up using produce a warning in the Console. This is how I noticed that I’d created a new problem.
I removed the entries for Cyrillic, since I can’t read it or write it. I removed only the preload directive for the Latin-Ext fonts, since I do occasionally use accented characters and the like. In the end, I had preload directives for only five woff2 files:
- The normal body text you’re reading now (PT Sans Regular, 400 weight)
- Bold and italics of the same face (PT Sans Italic 400 and PT Sans Regular 700).
- The typeface I use only for the page title.
- The typeface I use for source code listings (Source Code Pro) in both regular and bold.
This made things a little bit faster, but I couldn’t help but notice that each of the two Source Code Pro files was over 70 kiB. They were larger than the other preloaded fonts combined.
After poking at them with various tools, I realized the problem: my other fonts were subsets, but the Source Code Pro files contained the entire font. This includes a lot of stuff I don’t use in code, like Chinese characters and ligatures.
I used the pyftsubset program from the fonttools package (python-fonttools
on Arch) to generate subsets of the files, like this:
pyftsubset static/fonts/SourceCodePro-Medium.otf.woff2 \
  --unicodes="U+0020-007F,U+00A0-00FF,U+20AC,U+20BC,U+2010,U+2013,U+2014,U+2018,U+2019,U+201A,U+201C,U+201D,U+201E,U+2039,U+203A,U+2026,U+2022" \
  --ignore-missing-glyphs \
  --layout-features-=dnom,frac,numr
This reduced the 77 kiB font down to 17 kiB, while preserving the ASCII character set that tends to appear in source code, plus some typographical characters and accented characters that may appear in my comments.
Since there’s one font I only use for the page title, I was able to subset that even more aggressively – only preserving the handful of Latin characters I need to write the title:
pyftsubset static/fonts/zOL64pLDlL1D99S8g8PtiKchq-dmjQ.woff2 \
    --text="Cliffle" \
    --ignore-missing-glyphs \
    --layout-features-=dnom,frac,numr
That font now costs only 3 kiB – considerably smaller than the text of the article you’re reading.
Combining CSS files
At this point, things were quite a bit faster, and there was only one thing in the page’s behavior that was kinda bugging me: it was loading five separate CSS stylesheets. That’s four extra requests, which add to the data transfer and latency.
I’m using Zola to render this site, which supports Sass stylesheets natively. I
was able to use Sass’s @forward directive to flatten all my stylesheets into
one at site-generation-time:
@@@@@To be able to include the media="print" stylesheet, I needed to modify it by
enclosing its contents in a media directive:
{
/* former contents go here */
}
Otherwise, the print style would override the normal display style for all users, which would defeat the point.
Results
Here’s the network timeline using the simulated 2G connection after my changes:
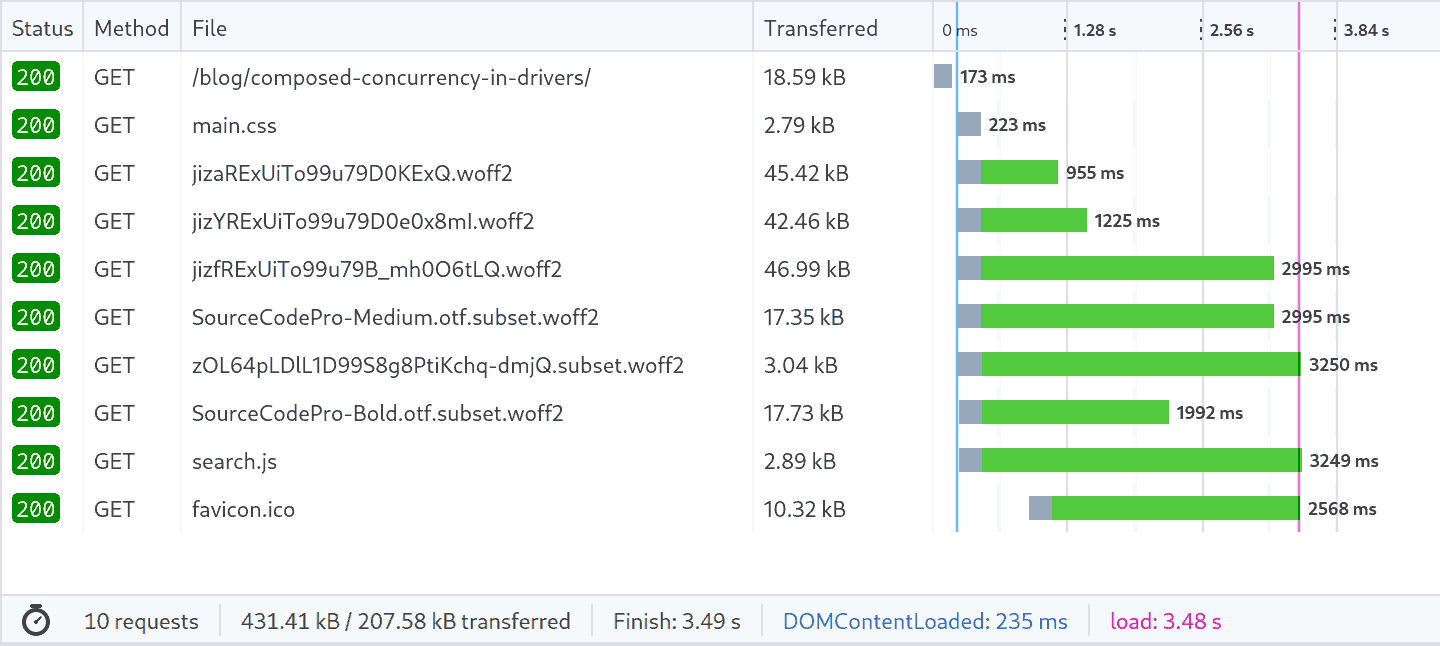
The transfer size for the entire page is now smaller than one of the files that was being transferred before (the search index). Total load time is now under 4 seconds (down from 11).
But more importantly, the perceived loading of the page is much faster. Here’s an animation, if you’re curious:
Large GIF hidden by default, may take a bit to load
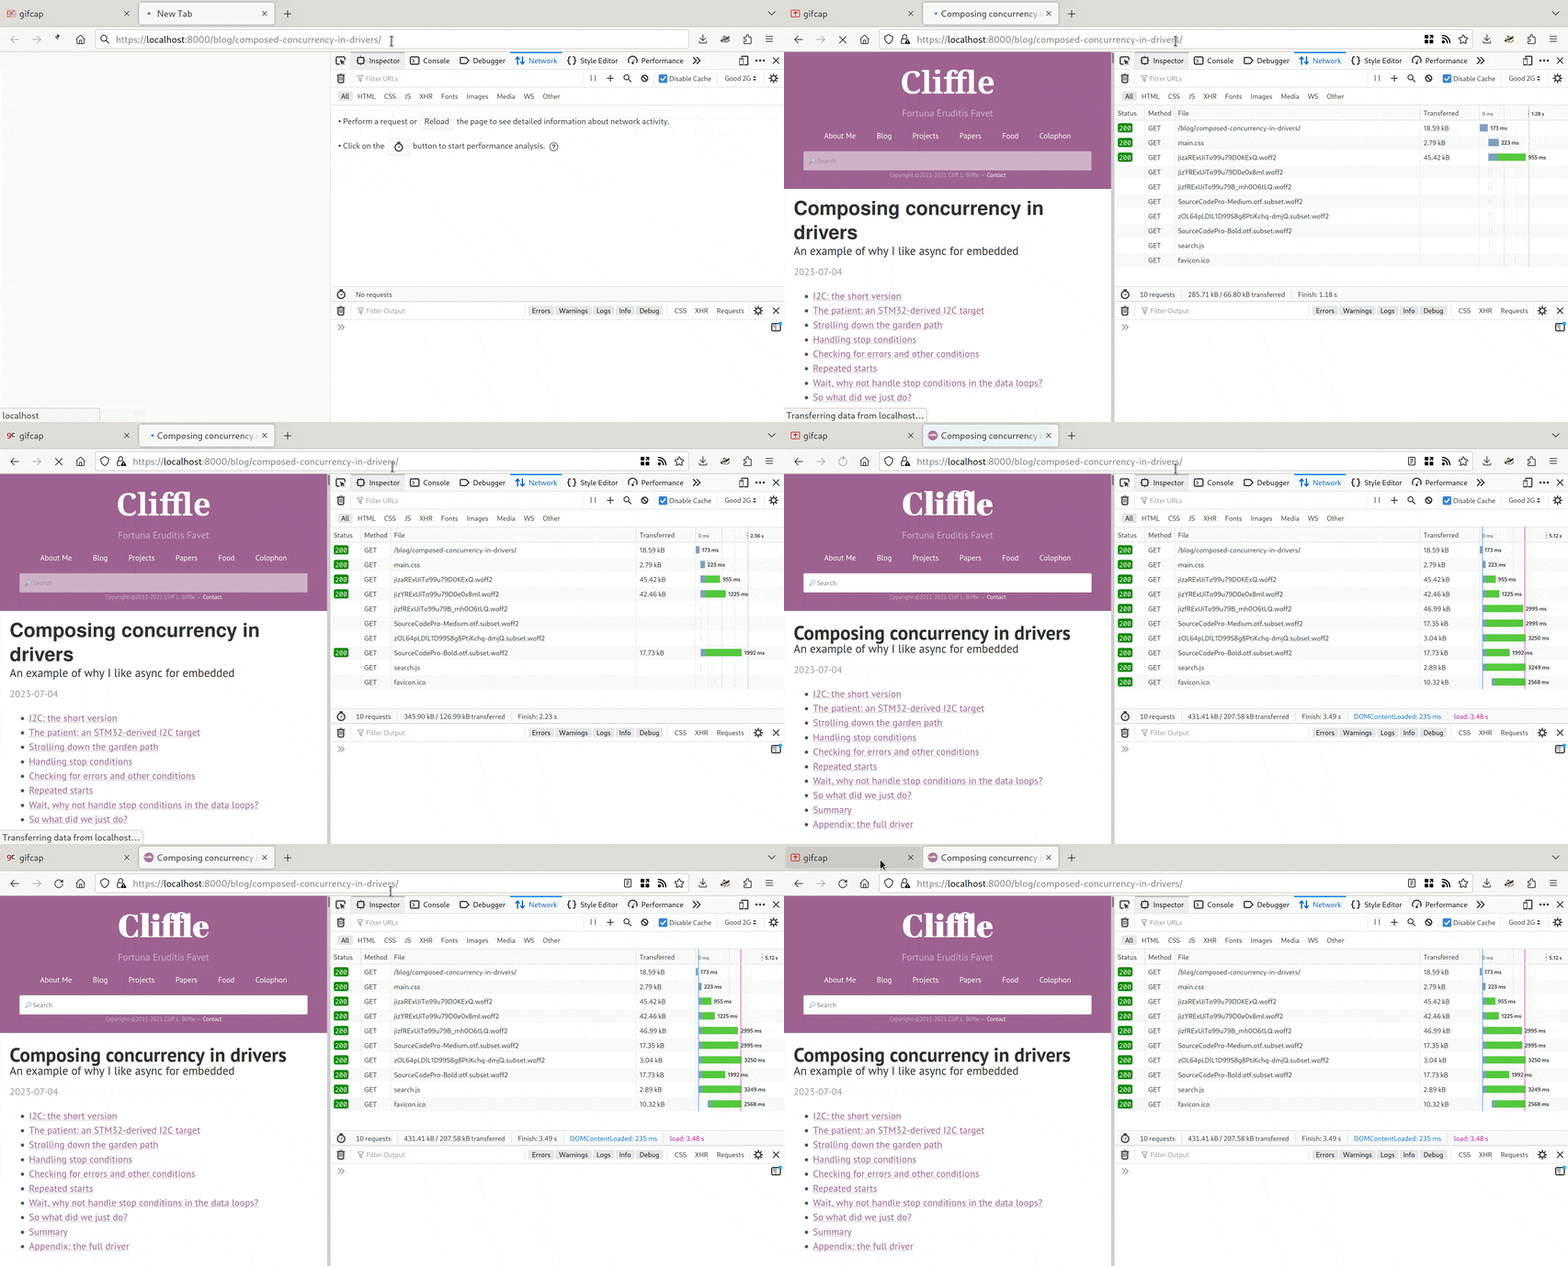
The page becomes readable with almost its final layout in about 300 ms. The fonts change over the next second or so, which is unfortunate but hard to avoid when using webfonts. However, because the metrics (character shape etc) of my custom fonts are pretty close to a typical sans-serif replacement font used by a web browser, the page only jumps by about one line of text – so if the user has started reading, they should be able to find their place again easily.
This sort of optimization doesn’t only improve the experience of users with slower connections – it improves things for everyone. Here’s the page loading from my actual webserver, through my home internet connection, over wifi from a laptop:
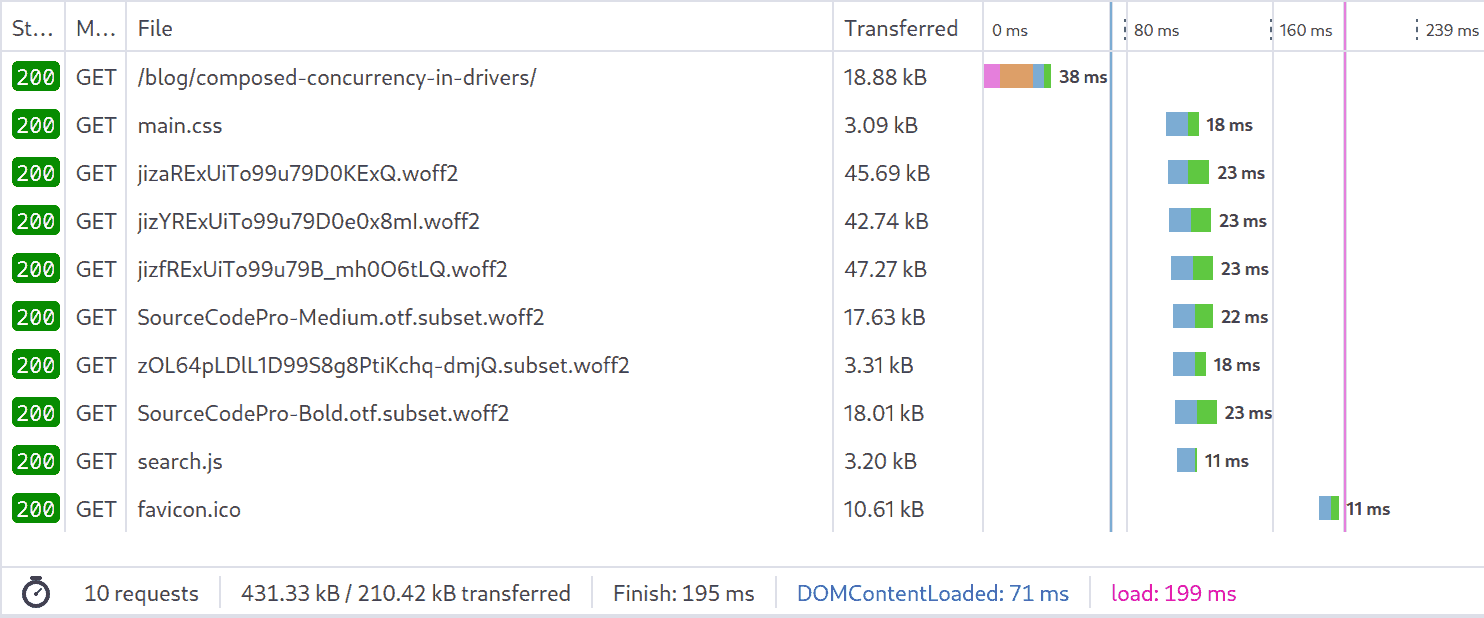
In under 150 ms, the page is done. Firefox hangs out for another 30 ms before
downloading the favicon (the site icon shown in the title bar). This is almost
as fast as loading the entire page from the browser cache (115 ms)!
Conclusions
The site should now be faster for everyone, but particularly for my readers with slower connections to the internet. You are too often forgotten by the modern web. I’m doing what I can to show you respect and goodwill.
I can’t really do anything about CNN’s site, but this one? This one I can fix.
I hope some of what I presented above is useful to other people trying to improve their own websites.
Appendix: how to lazy-load a big GIF without scripting
I wanted to include animated GIF screen recordings in this post, because I think they help to understand just how slow things can feel sometimes. But, they’re huge, and it seemed ironic to throw them into a post on how to make websites faster.
I worked out a way to combine two recent HTML features to lazily load them, without requiring Javascript.
First: loading="lazy". For a while you’ve been able to specify this attribute
on an <img> tag in HTML to ask the browser to defer loading the image until
it becomes visible.
In my humble opinion, this is almost always wrong, because it causes the layout to jump around (unless you’ve carefully specified width/height for the image, in which case, you’re doing it right). So, I don’t use it, typically.
It would also be inappropriate in this case, because I don’t want you to load the big GIF just by scrolling! I want to send it to you only on request.
There’s a standard way to make part of a page not visible until the user
requests it: the <details> tag. You may have seen this on big code examples in
some of my other posts.
So, combining these things, I used the following HTML to lazy-load the GIFs without scripting:
This is a big GIF, you have been warned!